
2.5 Graphs of Linear Functions
When we are working with a new function, it is useful to know as much as we can about the function: its graph, where the function is zero, and any other special behaviors of the function.
When graphing a linear function, there are two basic ways to graph it:
- By plotting points (at least 2) and drawing a line through the points
- Using the initial value (output when
 ) and rate of change (slope)
Example Graphing a Line with Points
Graph  by plotting points.
In general, we evaluate the function at two or more inputs to find at least two points on the graph. Usually it is best to pick input values that will “work nicely” in the equation.
In this equation, multiples of 3 will work nicely due to the \dfrac{2}{3} in the equation, and of course using to get the vertical intercept. Evaluating  at
at  and
and  :
: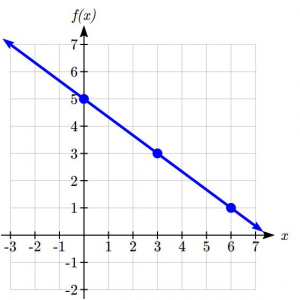


These evaluations tell us that the points (0,5), (3,3), and (6,1) lie on the graph of the line. Plotting these points and drawing a line through them gives us the graph.
Graphing a line using the initial value and rate of change
When using the initial value and rate of change to graph, we need to consider the graphical interpretation of these values. Remember the initial value of the function is the output when the input is zero, so in the equation  , the graph includes the point
  . On the graph, this is the vertical intercept – the point where the graph crosses the vertical axis.
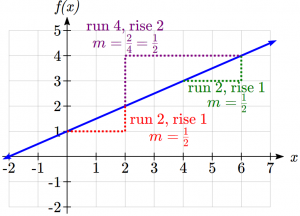
For the rate of change, it is helpful to remember that we calculated this value as:

From a graph of a line, this tells us that if we divide the vertical difference, or rise, of the function outputs by the horizontal difference, or run, of the inputs, we will obtain the rate of change, also called slope of the line.

Notice that this ratio is the same regardless of which two points we use.
Graphical Interpretation of a Linear Equation
Graphically, in the equation
 is the vertical intercept of the grpah and tells us we can start at
 is the slope of the line and tells us how far to rise & run to get to the next point.
Once we have at least 2 points, we can extend the graph of the line to the left and right.
Example Graphing a Line using Slope and Intercept
Graph using the vertical intercept and slope.
The vertical intercept of the function is (0, 5), giving us a point on the graph of the line. 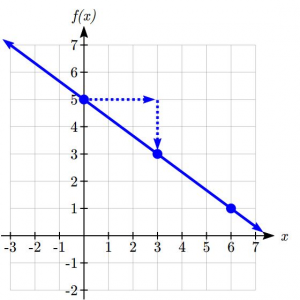
The slope is  . This tells us that for every 3 units the graph “runs” in the horizontal, the vertical “rise” decreases by 2 units. In graphing, we can use this by first plotting our vertical intercept on the graph, then using the slope to find a second point. From the initial value (0, 5) the slope tells us that if we move to the right 3, we will move down 2, moving us to the point (3, 3). We can continue this again to find a third point at (6, 1). Finally, extend the line to the left and right, containing these points.
Try it Now 1
Consider that the slope  could also be written as
  . Find another point on the graph that has a negative
  value.
The Actions of the Slope and Vertical Intercepts
In , the value of determines the steepness of the line. When is positive the graph will be increasing, and when is negative the graph will be decreasing. Looking at some examples: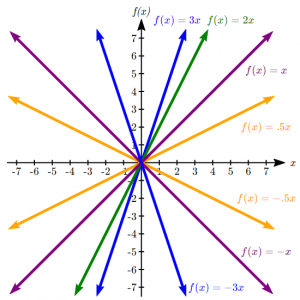
In , the acts as a vertical shift, moving the graph up and down without affecting the slope of the line. Some examples: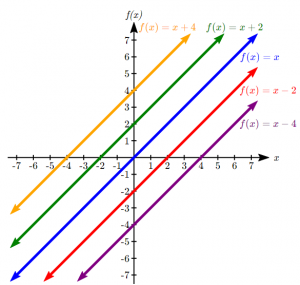
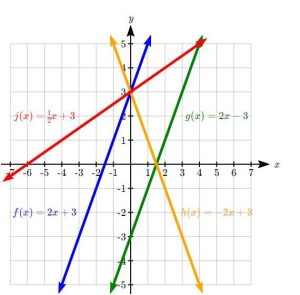
Examples Matching Equations to their Graphs
Match each equation with one of the lines in the graph below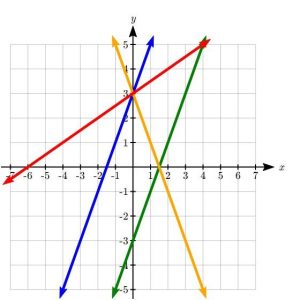


The Horizontal Intercept and Vertical and Horizontal Lines
In addition to understanding the basic behavior of a linear function (increasing or decreasing, recognizing the slope and vertical intercept), it is often helpful to know the horizontal intercept of the function – where it crosses the horizontal axis.
Finding Horizontal Intercept
The horizontal intercept of the function is where the graph crosses the horizontal axis. If a function has a horizontal intercept, you can always find it by solving  .
.
Example Finding Horizontal Intercept
Find the horizontal intercept of 
Setting the function equal to zero to find what input will put us on the horizontal axis,


The graph crosses the horizontal axis at (6,0)
There are two special cases of lines: a horizontal line and a vertical line. In a horizontal line like the one graphed to the right, notice that between any two points, the change in the outputs is 0. In the slope equation, the numerator will be 0, resulting in a slope of 0. Using a slope of 0 in the , the equation simplifies to  . Notice a horizontal line has a vertical intercept, but no horizontal intercept (unless it’s the line ).
In the case of a vertical line, notice that between any two points, the change in the inputs is zero. In the slope equation, the denominator will be zero, and you may recall that we cannot divide by the zero; the slope of a vertical line is undefined. You might also notice that a vertical line is not a function. To write the equation of vertical line, we simply write input=value, like  .
.
Notice a vertical line has a horizontal intercept, but no vertical intercept (unless it’s the line ).
Horizontal and Vertical Lines
Horizontal lines have equations of the form
Vertical lines have equations of the form 
Examples Writing Equations of Horizontal and Vertical Lines
a. Write an equation for the horizontal line graphed above.
This line would have the equation  or equivalently
  .
.
b. Write an equation for the vertical line graphed above.
This line would have the equation  .
.
Parallel and Perpendicular Lines
When two lines are graphed together, the lines will be parallel if they are increasing at the same rate – if the rates of change are the same. In this case, the graphs will never cross (unless they’re the same line).
Parallel Lines
Two lines are parallel if the slopes are equal (or, if both lines are vertical). In other words, given two linear equations  and
and  , then the lines will be parallel if
  .
.
Example Finding the Equation of a Line Parallel to a Given Line
Find a line parallel to  that passes through the point (3, 0).
We know the line we’re looking for will have the same slope as the given line, m = 3. Using this and the given point, we can solve for the new line’s vertical intercept:


The line we’re looking for is 
If two lines are not parallel, one other interesting possibility is that the lines are perpendicular, which means the lines form a right angle (90 degree angle – a square corner) where they meet. In this case, the slopes when multiplied together will equal -1. Solving for one slope leads us to the definition:
Perpendicular Lines
Given two linear equations and , the lines will be perpendicular if  and so
  of each other.
Examples Finding Perpendicular Lines and Writing Equations of Perpendicular Lines
i. a slope of 2 ii. a slope of -4 iii. a slope of 
i. A line perpendicular to a line with slope 2 would have slope = 
ii. A line perpendicular to a line with slope -4 would have slope = 
iii. A line perpendicular to a line with slope would have slope = 
b. Find the equation of a line perpendicular to and passing through the point (3,0).
The original line has slope  . The perpendicular line will have slope
  .
.
Using this and the given point, we can find the equation for the line.


The line we’re looking for is 
Try it Now 2
Given the line  , find an equation for the line passing through (0,0) that is:
a. Parallel to 
b. Perpendicular to
Intersections of Lines
The graphs of two lines will intersect if they are not parallel. They will intersect at the point that satisfies both equations. To find this point when the equations are given as functions, we can solve for an input value so that . In other words, we can set the formulas for the lines equal, and solve for the input that satisfies the equation.
Example Finding Intersections of Lines
Find the intersection of the lines  and
and 
Setting  ,
,


This tells us the lines intercept when the input is  .
.
We can then find the output value of the intersection point by evaluation either function at this input:

These lines intersect at the point  . Looking at the graph, this result seems reasonable.
Also note that we can use technology to determine these intersections as well. Using Desmos, we enter both and can simply click the intersection. For a TI calculator, check out this video on finding intersections of lines. For Casio, try this video.
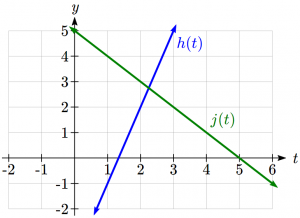
Try it Now 3
3. Look at the graph in example 11 above and answer the following for the function j(t):
a. Vertical intercept coordinates
b. Horizontal intercepts coordinates
c. Slope
d. Is j(t) parallel or perpendicular to h(t) (or neither)
e. Is j(t) an Increasing or Decreasing function (or neither)
Try It Now Answers
1. (-3,7) found by starting at the vertical intercept, going up 2 units and 3 in the negative horizontal direction. You could have also answered, (-6, 9) or (-9, 11) etc…
2. Parallel:  ; Perpendicular:
3. Given j(t) = 5-t
a. (0,5)
b. (5,0)
c. Slope -1
d. Neither parallel nor perpendicular
e. Decreasing function
Media Attributions
- examplegraph2.5
- slopeillustration
- examplegraph2.5_2
- graphsoflines
- graphofparallellines
- graphmatchingexample
- matchgraphexamplesolution
- examplegraph2.5_3
