
6.7 Transformation of Functions
Often when given a problem, we try to model the scenario using mathematics in the form of words, tables, graphs and equations in order to explain or solve it. When building models, it is often helpful to build off of existing formulas or models. Knowing the basic graphs of your tool-kit functions can help you solve problems by being able to model new behavior by adapting something you already know. Unfortunately, the models and existing formulas we know are not always exactly the same as the ones presented in the problems we face.
Fortunately, there are systematic ways to shift, stretch, compress, flip and combine functions to help them become better models for the problems we are trying to solve. We can transform what we already know into what we need, hence the name, “Transformation of functions.” When we have a story problem, formula, graph, or table, we can then transform that function in a variety of ways to form new functions.
Parent Functions
Before we begin transforming them, let’s review the parent functions that everyone should know.
| Function | Graph | Domain | Range |
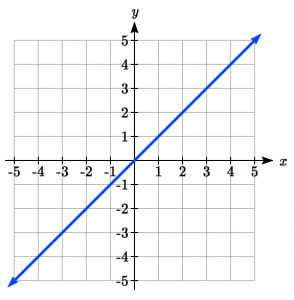
Linear  |
 |
 |
|
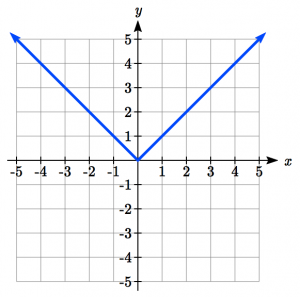
Absolute Value:  |
 |
|
 |
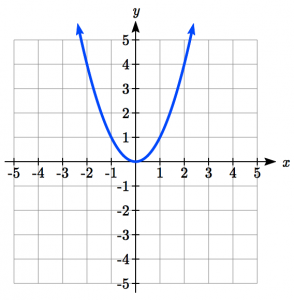
Quadratic:  |
 |
|
|
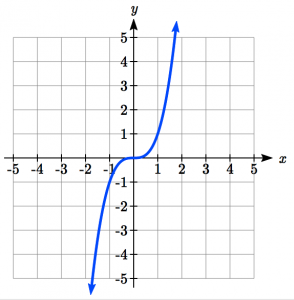
Cubic:  |
 |
|
|
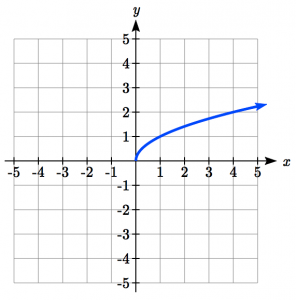
Square Root:  |
 |
|
|
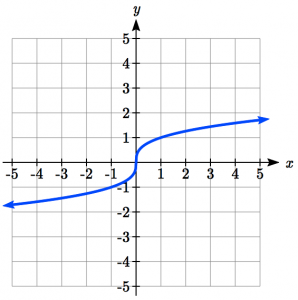
Cube Root: ![f(x)=\sqrt[3]{x}](https://ua.pressbooks.pub/app/uploads/quicklatex/quicklatex.com-179529c89120e6537d6fea0584e9ee4a_l3.png "Rendered by QuickLaTeX.com") |
 |
|
|
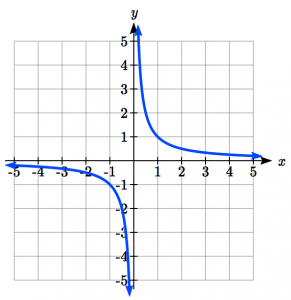
Reciprocal:  |
 |
 |
|
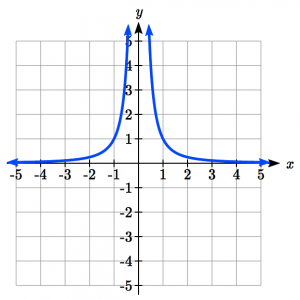
Reciprocal Squared:  |
 |
|
 |
Knowing these functions, we can consider how to transform them, which creates a much easier way to graph, or sketch many different functions.
Shifts
If we want to look at the function  , we know from graphing quadratic functions that this means the vertex is (0,4) instead of (0,0) which is the vertex of the parent function, . Notice that this moves up the vertex 4 units.
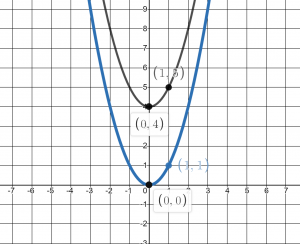
Similarly, we could look at the other points, such as  and
and  , which are 1 and 5 respectively, we see that
  is just the graph
  moved up 4 units.
This is an example of a vertical shift. The input values stay the same and only the output values change. The range also changes. The range of is and the range of is moved up 4 with the graph to 
Vertical Shift
Given a function , if we define a new function as
 , where
  is a constant
then is a vertical shift of the function , where all the output values have been increased by .
If is positive, then the graph will shift up
If is negative, then the graph will shift down
Example of a Vertical Shift with a Function Defined as a Table
A function is given as a table below. Create a table for the function 
| x | 2 | 4 | 6 | 8 |
| f(x) | 1 | 3 | 7 | 11 |
The formula tells us that we can find the output values of the g function by subtracting 3 from the output values of the f function. For example,


Subtracting 3 from each value, we can complete a table of values for
| x | 2 | 4 | 6 | 8 |
| g(x) | -2 | 0 | 4 | 8 |
As with the earlier vertical shift, notice the input values stay the same and only the output values change.
Try it Now 1
The function  gives the height h of a ball (in meters) thrown upwards from the ground after t seconds. Suppose the ball was instead thrown from the top of a 10 meter building. Relate this new height function b(t) to h(t), then find a formula for b(t).
The vertical shift is a change to the output, or outside, of the function. We will now look at how changes to input, on the inside of the function, change its graph and meaning.
Consider the function  . In a similar, parent function, , there is a point in the center at (0,0). But, in order for to have an output of 0,
  would have to be
  . So we have a point at (4,0). Now consider, what we would need to have an output of 1.

Take the cube root of both sides:
![\sqrt[3]{x-4^3}=\sqrt[3]{1}](https://ua.pressbooks.pub/app/uploads/quicklatex/quicklatex.com-5752c0f452375d4d85411c82ce5f1f12_l3.png "Rendered by QuickLaTeX.com")


So we have a point at (5,1) for and (1,1) for Notice that now the outputs stay the same, but the inputs change. is moved to the right 4 units as seen below:
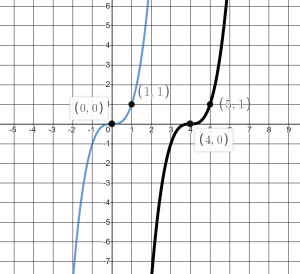
Horizontal changes or “inside changes” affect the domain of a function (the input) instead of the range and often seem counter-intuitive. The new function uses the same outputs as , but matches those outputs to inputs 4 units less than those of . Said another way, we must add 4 to the input of  to find the corresponding output for :
  .
.
Horizontal Shift
Given a function , if we define a new function as
 , where
  is a constant
then is a horizontal shift of the function
If h is positive, then the graph will shift right
If h is negative, then the graph will shift left
Example of a Horizontal Shift with a Table
A function is given as a table below. Create a table for the function 
| x | 2 | 4 | 6 | 8 |
| f(x) | 1 | 3 | 7 | 11 |
The formula tells us that the output values of g are the same as the output value of f with an input value three smaller. For example, we know that . To get the same output from the g function, we will need an input value that is 3 larger: We input a value that is three larger for g(x) because the function takes three away before evaluating the function f.

| x | 5 | 7 | 9 | 11 |
| g(x) | 1 | 3 | 7 | 11 |
The result is that the function g(x) has been shifted to the right by 3. Notice the output values for g(x) remain the same as the output values for f(x) in the chart, but the corresponding input values, x, have shifted to the right by 3: 2 shifted to 5, 4 shifted to 7, 6 shifted to 9 and 8 shifted to 11.
Example of a Horizontal Shift with a Graph
The graph shown is a transformation of a parent function . Relate this new function g(x) to f(x), and then find a formula for g(x).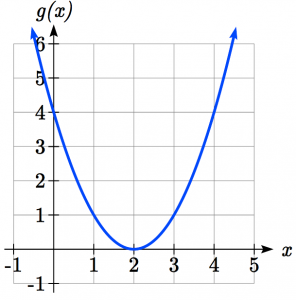
Notice that the graph looks almost identical in shape to the function, but the x values are shifted to the right two units. The vertex used to be at (0, 0) but now the vertex is at (2, 0) . The graph is the basic quadratic function shifted two to the right, so 
Notice how we must input the value x = 2, to get the output value y = 0; the x values must be two units larger, because of the shift to the right by 2 units.
We can then use the definition of the f(x) function to write a formula for g(x) by evaluating  :
:
Since and

Notice how the domain and range are the same for this function. The domain is subject to change with horizontal shifts, but in this case, both are all real numbers or
If you find yourself having trouble determining whether the shift is +2 or -2, it might help to consider a single point on the graph. For a quadratic, looking at the vertex is convenient. In the original function,  . In our shifted function,
  . To obtain the output value of 0 from the f function, we need to decide whether a +2 or -2 will work to satisfy
  . For this to work, we will need to subtract 2 from our input values.
When thinking about horizontal and vertical shifts, it is good to keep in mind that vertical shifts are affecting the output values of the function, while horizontal shifts are affecting the input values of the function.
Example of an Application with a Shift
The function G(m) gives the number of gallons of gas required to drive m miles. Interpret  and G(m+10) .
is adding 10 to the output gallons. This is 10 gallons of gas more than is required to drive m miles. So, this is the gas required to drive m miles, plus another 10 gallons of gas, or maybe the amount of gas required to drive m miles and have 10 gallons left in the tank.
 is adding 10 to the input, miles. This is the number of gallons of gas required to drive 10 miles more than m miles. So this might be what you want if you want to give yourself a 10 mile buffer before you run out of gas.
Try it Now 2
Given the function graph the original function and the transformation  .
.
a. Is this a horizontal or a vertical change?
b. Which way is the graph shifted and by how many units?
c. Graph and on the same axes.
d. What is the domain and range of ?
Now that we have two transformations, we can combine them together.

Vertical Shifts are outside changes that affect the output (vertical) axis values shifting the transformed function up or down. Up if the constant is added, down if subtracted.
Horizontal Shifts are inside changes that affect the input (horizontal) axis values shifting the transformed function left or right. Right if the constant is subtracted and left if it is added.
Examples of a Functions Shifted both Horizontally and Vertically
Given  , sketch a graph of
  and give the new domain and range.
The function f is our parent absolute value function. We know that this graph has a V shape, with the point at the origin. The graph of h has transformed f in two ways:  is a change on the inside of the function, giving a horizontal shift left by 1, then the subtraction by 3 in
  . is a change to the outside of the function, giving a vertical shift down by 3. Transforming the graph gives:
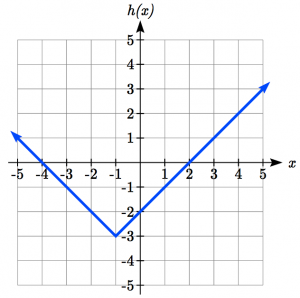
The domain of the transformed function is still , but the range has changed to  .
.
b.Write a formula for the graph shown, a transformation of the parent square root function.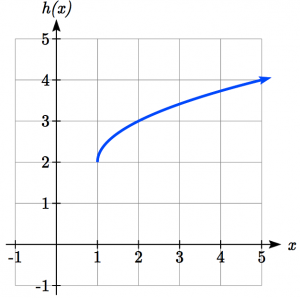
The graph of the parent function starts at the origin, so this graph has been shifted 1 to the right, and up 2. In function notation, we could write that as  . Using the formula for the square root function we can write
Note that this transformation has changed the domain and range of the function. This new graph has domain  and range
  .
.
Reflections
Another transformation that can be applied to a function is a reflection over the horizontal or vertical axis.
Examples
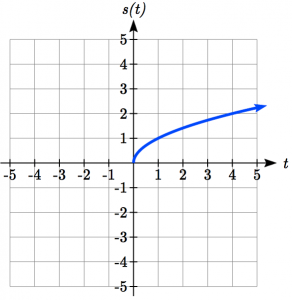
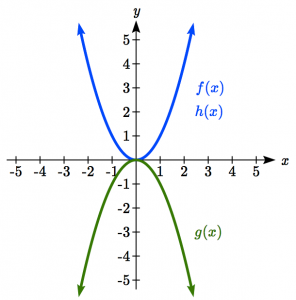
Reflect the graph of  both vertically and horizontally.
Reflecting the graph vertically, each output value will be reflected over the horizontal t axis:
 |
 |
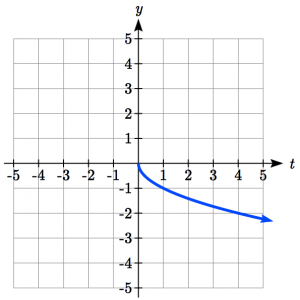 |
Since each output value is the opposite of the original output value, we can write:


Notice this is an outside change or vertical change that affects the output  values so the negative sign belongs outside of the function.
Reflecting horizontally, each input value will be reflected over the vertical axis.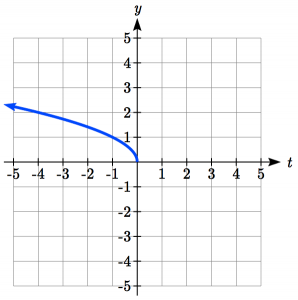
Since each input value is the opposite of the original input value, we can write:


Notice this is an inside change or horizontal change that affects the input values so the negative sign is on the inside of the function.
Note that these transformations can affect the domain and range of the functions. While the original square root function has domain and range , the vertical reflection gives the  function the range
 ![(-\infty,0]](https://ua.pressbooks.pub/app/uploads/quicklatex/quicklatex.com-9c3f5062653097ec21c4a3247c963848_l3.png "Rendered by QuickLaTeX.com") , and the horizontal reflection gives the
, and the horizontal reflection gives the  function the domain . (Because in order to take the square root of -t, t must be negative, for example, -2, as
  .
.
Reflections
Given a function , if we define a new function as
 ,
,
then is a vertical reflection of the function , sometimes called a reflection about the x-axis or horizontal axis.
If we define a new function as
 ,
,
then is a horizontal reflection of the function , sometimes called a reflection about the y-axis or vertical axis.
Example of Reflections with Functions defined as Tables
A function is given as a table below. Create a table for the function and
| x | 2 | 4 | 6 | 8 |
| f(x) | 1 | 3 | 7 | 11 |
For , this is a vertical reflection, so the x values stay the same and each output value will be the opposite of the original output value:
| x | 2 | 4 | 6 | 8 |
| g(x) | -1 | -3 | -7 | -11 |
For  , this is a horizontal reflection, and each input value will be the opposite of the original input value and the values stay the same as the values:
| x | -2 | -4 | -6 | -8 |
| h(x) | 1 | 3 | 7 | 11 |
Try it Now 3
Given the parent function , graph  and
and  . Do you notice anything surprising?
Stretches and Compressions
With shifts, we saw the effect of adding or subtracting to the inputs or outputs of a function. We now explore the effects of multiplying the inputs or outputs.
Remember, we can transform the inside (input values) of a function or we can transform the outside (output values) of a function. Each change has a specific effect that can be seen graphically.
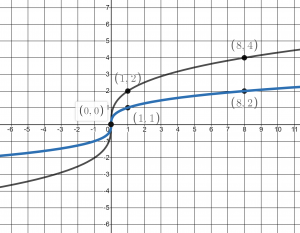
Consider the function ![g(x)=2\sqrt[3]{x}](https://ua.pressbooks.pub/app/uploads/quicklatex/quicklatex.com-59b8d5485a0dd37d0ea422f67080d0ee_l3.png "Rendered by QuickLaTeX.com") . In the parent function, , the point in the center at (0,0) is still there in . However, what about an input of 1, the parent function has the point (1,1), but multiplies it by 2, so the point is at (1,2). If we consider an input at 8, the parent function has a point at (8,2), but is (8,4). So the output is doubled each time. This is a vertical stretch as seen below:
. In the parent function, , the point in the center at (0,0) is still there in . However, what about an input of 1, the parent function has the point (1,1), but multiplies it by 2, so the point is at (1,2). If we consider an input at 8, the parent function has a point at (8,2), but is (8,4). So the output is doubled each time. This is a vertical stretch as seen below:
Vertical Stretch and Compression
Given a function , if we define a new function as
 , where is a constant
then is a vertical stretch or compression of the function .
If  , then the graph will be stretched
If  , then the graph will be compressed
If  , then there will be combination of a vertical stretch or compression with a vertical reflection
Example of a Vertical Compression with a Table
A function is given as a table below. Create a table for the function 
| x | 2 | 4 | 6 | 8 |
| f(x) | 1 | 3 | 7 | 11 |
The formula tells us that the output values of  are half the output values of with the same inputs. For example, we know that
  , so
, so 
| x | 2 | 4 | 6 | 8 |
| g(x) | 1/2 | 3/2 | 7/2 | 11/2 |
The result is that the function has been compressed vertically by ½. Each output value has been cut in half, so the graph would now be half the original height.
Example of a Vertical Stretch/Compression of a Graph
The graph shown is a transformation of the parent function . 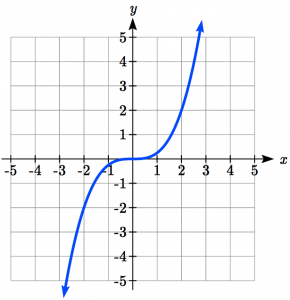 Relate this new function to , then find a formula for .
When trying to determine a vertical stretch or shift, it is helpful to look for a point on the graph that is relatively clear. In this graph, it appears that  With the basic cubic function at the same input,
Based on that, it appears that the outputs of g are ¼ the outputs of the function f, since

From this we can fairly safely conclude that:

We can write a formula for by using the definition of the function

Try it Now 4
Use the parent function to graph  and give the domain and range of .
Horizontal stretches and compressions are also possible, but we can usually re-write the function so that this is a vertical stretch or compression. For example, a horizontal compression of the function by ½ would result in a new function  , but this can also be written as
  , a vertical stretch of by 4. When writing a formula for a transformed parent function, we only need to find one transformation that would produce the graph.
Combining Transformations
When combining transformations, it is very important to consider the order of the transformations. For example, vertically shifting by 3 and then vertically stretching by 2 does not create the same graph as vertically stretching by 2 then vertically shifting by 3.
When we see an expression like  , which transformation should we start with? The answer here follows nicely from order of operations, for outside transformations. Given the output value of , we first multiply by 2, causing the vertical stretch, then add 3, causing the vertical shift. (Multiplication before Addition)
Combining Vertical Transformations
When combining vertical transformations written in the form  ,
,
first vertically stretch by a, then vertically shift by k.
Horizontal transformations are a little trickier to think about. When we write  for example, we have to think about how the inputs to the g function relate to the inputs to the f function. Suppose we know
  . What input to g would produce that output? In other words, what value of x will allow
  ? We would need 3-x=12. To solve for x, we would first subtract 3, resulting in horizontal shift, then multiply by -1, causing a horizontal reflection.
Independence of Horizontal and Vertical Transformations
Horizontal and vertical transformations are independent. It does not matter whether horizontal or vertical transformations are done first.
Example of Several Transformations with a Table
Given the table of values for the function below, create a table of values for the function 
| x | 6 | 12 | 18 | 24 |
| f(x) | 10 | 14 | 15 | 17 |
There are 3 steps to this transformation and we will work from the inside out. Starting with the horizontal transformations, is a horizontal shift to the left by 2, which means we subtract each x value by 2.
| x | 4 | 10 | 16 | 22 |
| f(x+2) | 10 | 14 | 15 | 17 |
Looking now to the vertical transformations, we start with the vertical stretch, which will multiply the output values by 3. We apply this to the previous transformation.
| x | 4 | 10 | 16 | 22 |
| 3f(x+2) | 30 | 42 | 45 | 51 |
Finally, we can apply the vertical shift, which will add 1 to all the output values.
| x | 4 | 10 | 16 | 22 |
| 3f(x+2)+1 | 31 | 43 | 46 | 52 |
Example of Multiple Transformation of a Graph
Use the parent function , sketch a graph of 
First, we see that 2 in the denominator and we did not cover horiztonal stretches, so we will change this slightly to  . This makes a little easier to see that the -1/2 is just a vertical compression and reflection.
See the animation below: We begin with our parent function: .
Let’s start with our horizontal (inside) transformation and graph  which is just a shift of 3 to the left.
Then, we will do our vertical transformations, starting with a vertical compression by 1/2 and then a reflection across the x-axis.
Finally we have the vertical shift of 1 unit down.
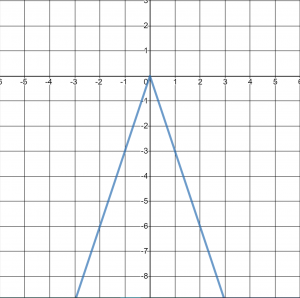
Example Writing a Transformed Function from the Graph
Write an equation for the transformed graph function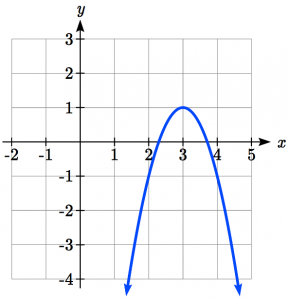 shown and give the domain and range.
This looks like a parabola so let’s try our parent function
Observing the graph, we notice several transformations:
The original parent function has been flipped over the x axis, a vertical stretch has occurred, and we can see a shift to the right 3 units and a shift up 1 unit.
In total there are four operations:
- Vertical reflection, requiring a negative sign outside the function
- Vertical Stretch of 2 (remember that concave down parabolas start with over 1 down 1, this one is over 1, down 2)
- Horizontal Shift Right 3 units, which tells us to put
 on the inside of the function
 - Vertical Shift up 1 unit, telling us to add 1 on the outside of the function
So this takes our parent function, :
- First do the horizontal shift

- Now the Stretch:

- Now the Reflection:

- And now the vertical shift:

This looks familiar, it is the vertex form of a parabola! If you had trouble figuring out the transformations, that’s okay. We can still find the formula for a parabola using the techniques we discussed in chapter 5. All we need is the vertex and another point.
The domain is still but the range is now ![(-\infty,1]](https://ua.pressbooks.pub/app/uploads/quicklatex/quicklatex.com-ee8f12c372aea16c5bd8034d0230ef4f_l3.png "Rendered by QuickLaTeX.com")
Try it Now 5
a. Try graphing  and give the domain and range.
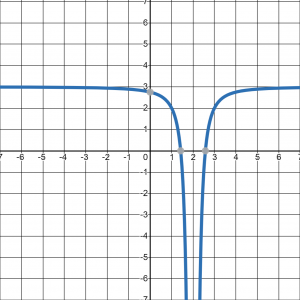
b. Try to figure out the what the parent function (it’s one of the ones at the beginning of the section) and transformations are, figure out the domain and range and write an equation for this graph:
Try it Now Answers

- a. Horizontal shift
b. The function is shifted to the LEFT by 2 units
c.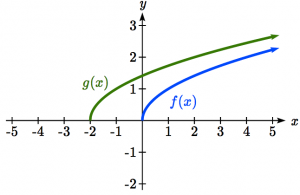
Answer Graph 2c d. Domain:
 Range:
 - Notice looks the same as
Answer Graph 3 - Domain: Range:
Answer Graph 4 - a. Domain:
 Range:
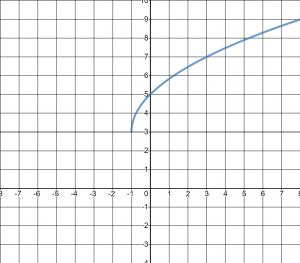
Answer Graph 5a b. The parent function is the square reciprocal:
. It is shifted right 2 units, reflected on the x-axis and up 3: 
Domain:
 Range:
Media Attributions
- linear
- absvalue
- square
- cubic
- sqroot
- cuberoot
- recip
- squaredrecip
- graphofverticalshift
- graphofhorizshift
- 66example6
- Reminder is licensed under a Public Domain license
- 67example1
- 67example2
- 67example3
- 67example4
- 67example5
- graphofvertstretch
- 67example7
- 67example6
- TIN67
- tinasnwer672
- tinanswer673
- tinanswer674
- tinanswer675
