
5.1 Quadratic Functions and Their Graphs
Quadratics commonly arise from problems involving areas, as well as revenue and profit, providing some interesting applications.
Example of an Application of Quadratic Functions
A backyard farmer wants to enclose a rectangular space for a new garden. She has purchased 80 feet of wire fencing to enclose 3 sides, and will put the 4th side against the backyard fence. Find a formula for the area enclosed by the fence if the sides of fencing perpendicular to the existing fence have length L.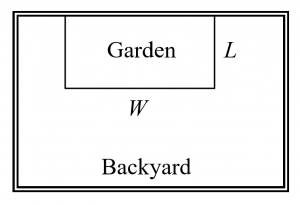
In a scenario like this involving geometry, it is often helpful to draw a picture. It might also be helpful to introduce a temporary variable, W, to represent the side of fencing parallel to the 4th side or backyard fence.
Since we know we only have 80 feet of fence available, we know that  , or more simply,
  . This allows us to represent the width, W, in terms of L:
  .
.
Now we are ready to write an equation for the area the fence encloses. We know the area of a rectangle is length multiplied by width, so


This formula represents the area of the fence in terms of the variable length L.
Short run Behavior: Vertex
We now explore the interesting features of the graphs of quadratics. In addition to intercepts, quadratics have an interesting feature where they change direction, called the vertex.
The standard form for a quadratic is  , but you will also see them written in the form
  . To see why, consider this example.
Example of a Quadratic Graph
Sketch a graph of 
We can create a table of values, which we can use to plot several points and connect them with a smooth curve.
| x | g(x) |
| -5 | 1.5 |
| -4 | -1 |
| -3 | -2.5 |
| -2 | -3 |
| -1 | -2.5 |
| 0 | -1 |
| 1 | 1.5 |
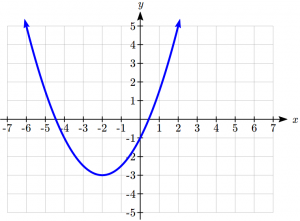 Notice that the turning point of the graph, where it changes from decreasing to increasing is at the point (-2,-3). We call this point the vertex of the quadratic. Notice that can also be written
  . Comparing that to the form , you can see that the vertex of the graph, (-2,3), corresponds with the point,
  .
.
Forms and Properties of Quadratic Functions
The standard form of a quadratic function is
The vertex form of a quadratic function is
- The vertex of the quadratic function is located at , where h and k are the numbers in the vertex form of the function.
- The shape of the graph of a quadratic functions is called a parabola.
- Graphs of quadratic functions are also symmetric around a vertical line through the vertex,
 . This line is called the axis of symmetry.
When a > 0, the graph of the quadratic will open upwards. This is known as concave up.
When a < 0, the graph of the quadratic will open downwards. This is known as concave down.
The vertex form of a quadratic is the simplest form to graph. Look back at the graph in the previous example, .
Notice that  and the parabola opens up. Also notice that if we move from the vertex and go left or right 1 unit from the vertex, the point on the graph is 1/2 unit up and if you go another unit over, you go up 1 1\2 or 3
  1/2 units up, which is
  units. This same pattern can be used with any quadratic to quickly sketch the graph.
Graphing Quadratics in Vertex Form Using the 1a-3a-5a Step Method
Given a quadratic function in vertex form, , we can follow the these steps to graph it.
- Start by graphing the vertex at .
- Move right 1 unit from the vertex and then
- If
 move up
  units.
 - If
 move down units.
- If
- Step another 1 unit to the right and move up units for
 or units down for
  .
. - If necessary, step another unit to the right and move up
 units for or units down for .
 - Use your axis of symmetry to draw the other side or follow the same steps moving to the left instead.
- Draw a smooth parabola through the points.
Examples Graphing Quadratics
Graph the following quadratic functions:
a. 
b. 
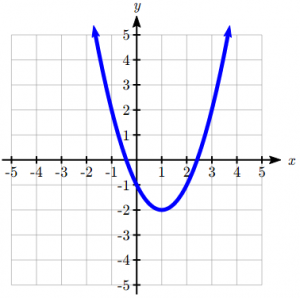
For a, notice the lack of a number before the parentheses, this is an understood 1. So our  . Since this is positive, our parabola is concave up.
The vertex is  So our first step is to graph this point.
Then we go right one, up one to  . right another and up 3 to
  and right another and up 5 to
  .
.
Using symmetry, we do all of this again to the left using the axis of symmetry at x = 3 to find points  ,
,  and
and  . Then draw our parabola, see the animation below:
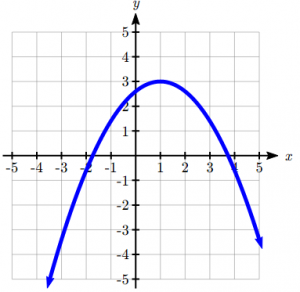
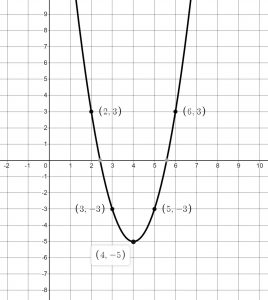
Let’s take a look at part b, , we notice that a is negative,  . Since this is negative, our parabola is concave down.
The vertex is  so this will be the first point graphed.
We then will go right one, down 2 since a is negative, and we have a point at  .
.
We then go right again and down 6 ( ), giving us a point at
Now, looking ahead if we go right again, we would have to go down 5(2)=10 units and would likely be off the grid, so we will stop at the points we have.
Using the axis of symmetry of  , we notice that we have points at (-2,3), (-3,-3) as well.
Then, we just draw our parabola, see the animation below:
 Notice in the second example, we only used 5 points to graph the parabola. As a general rule, to graph a line, you need a minimum of 2 points, but to graph a parabola you need a minimum of 5 points. It’s nice to have 7 or more to have a more accurate picture but as gets higher, graphs of quadratic functions increase or decrease very quickly and we often cannot fit in the last points on the graph.
Try it Now 1
Graph 
We can also use vertex form and these same ideas to look at a graphed parabola and figure out its equation.
Example of Determining the Equation from a Graphed Parabola
Find the equation for the parabola graphed here: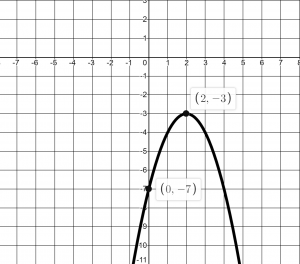
First, we notice that the vertex, is  so we start with
Now, we just need to figure a, we can do this one of two ways. We know that it is negative, to we can discover how far we go down 1 unit to the left or right of the vertex. If this is difficult to see, then we can use the other point  in our equation and solve for .


So, then the equation for the function would be  or
or 
Try it Now 2
Find the equation for the graph: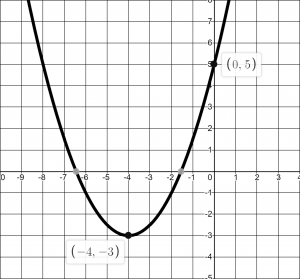
Example converting from Vertex to Standard Form
Write  in standard form.
To write this in standard polynomial form, we could expand the formula and simplify terms:

In the previous example, we saw that it is possible to rewrite a quadratic function given in vertex form and rewrite it in standard form by expanding the formula. It would be useful to reverse this process, since the transformation form reveals the vertex.
Expanding out the general transformation form of a quadratic gives:

This should be equal to the standard form of the quadratic:

The second degree terms are already equal. For the linear terms to be equal, the coefficients must be equal:
 , so
, so 
This provides us a method to determine the horizontal shift of the quadratic from the standard form. We could likewise set the constant terms equal to find:
 , so
, so 
In practice, though, it is usually easier to remember that  is the output value of the function when the input is
  , so
, so  .
.
Finding the Vertex of Quadratic in Standard Form
For a quadratic function in standard form, , the vertex is located at:
![\[h=-\dfrac{b}{2a}, \quad k=f(h)=f\left(\dfrac{-b}{2a} \right)\]](https://ua.pressbooks.pub/app/uploads/quicklatex/quicklatex.com-af57fd80578e3ab2ee99df93fcc68d22_l3.png "Rendered by QuickLaTeX.com")
Example Find the Vertex and Graphing a Quadratic Function in Standard Form
Find the vertex of the quadratic function  . Rewrite the quadratic into vertex form and graph.
The horizontal coordinate of the vertex will be at 
The vertical coordinator of vertex will be at 
Rewriting into vertex form, the value of will remain the same as in the original quadratic. 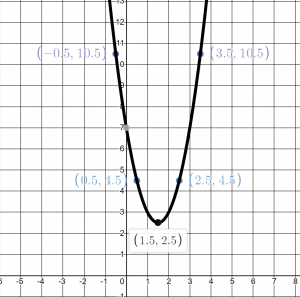

and now we can graph it. We know the vertex is 
 which is positive and thus the parabola opens up so we go right 1, up 2 and have a point at
  , right another up 6 so
  , then we use symmetry for the other side and get
  and
and 
Try it Now 3
Given the equation  write the equation in standard form, find the vertex, write in vertex form and graph.
In addition to enabling us to more easily graph a quadratic written in standard form, finding the vertex serves another important purpose – it allows us to determine the maximum or minimum value of the function, depending on which way the graph opens.
Application Examples
a. Returning to our backyard farmer from the beginning of the section, what dimensions should she make her garden to maximize the enclosed area?
Earlier we determined the area she could enclose with 80 feet of fencing on three sides was given by the equation . Notice that quadratic has been vertically reflected, since the coefficient on the squared term is negative, so the graph will open downwards, and the vertex will be a maximum value for the area.
In finding the vertex, we take care since the equation is not written in standard polynomial form with decreasing powers. But we know that a is the coefficient on the squared term, so a = -2, b = 80, and c = 0.
Finding the vertex:

The maximum value of the function is an area of 800 square feet, which occurs when L = 20 feet. When the shorter sides are 20 feet, that leaves 40 feet of fencing for the longer side. To maximize the area, she should enclose the garden so the two shorter sides have length 20 feet, and the longer side parallel to the existing fence has length 40 feet.
b.A local newspaper currently has 84,000 subscribers, at a quarterly charge of $30. Market research has suggested that if they raised the price to $32, they would lose 5,000 subscribers. Assuming that subscriptions are linearly related to the price, what price should the newspaper charge for a quarterly subscription to maximize their revenue?
Revenue is the amount of money a company brings in. In this case, the revenue can be found by multiplying the charge per subscription times the number of subscribers. We can introduce variables, C for charge per subscription and S for the number subscribers, giving us the equation:
Revenue = CS
Since the number of subscribers changes with the price, we need to find a relationship between the variables. We know that currently S = 84,000 and C = 30, and that if they raise the price to $32 they would lose 5,000 subscribers, giving a second pair of values, C = 32 and S = 79,000. From this we can find a linear equation relating the two quantities. Treating C as the input and S as the output, the equation will have form  . The slope will be

This tells us the paper will lose 2,500 subscribers for each dollar they raise the price. We can then solve for the vertical intercept

This gives us the linear equation relating cost and subscribers. We now return to our revenue equation.

We now have a quadratic equation for revenue as a function of the subscription charge. To find the price that will maximize revenue for the newspaper, we can find the vertex:

The model tells us that the maximum revenue will occur if the newspaper charges $31.80 for a subscription. To find what the maximum revenue is, we can evaluate the revenue equation:
Max R=
Maximum Revenue is $2,528,100
Notice that the equation  we found in the last example is essentially a demand function – a relationship between the price (C) and the demand (S). This is a common type of economic application.
Maximizing Revenue or Profit
To solve a problem involving maximizing revenue or profit given data on demand at different price levels,
- Use the data provided to create a demand equation relating price and quantity demanded. This will usually be a linear function.
- Create a Revenue Equation. Start with Revenue=price times quantity, then substitute the demand equation to create a revenue equation just in terms of quantity.
- If the problem is to maximize profit, create a Profit equation. Profit = (Revenue) – (Cost)
- Find the vertex of the Revenue or Profit function to find the quantity that maximizes revenue or profit.
- If needed, use that quantity with the demand function to find the price that maximizes revenue or profit.
Examples
A company is planning to sell a new smart fitness device. Developing the product will cost $700,000, and each product will cost $30 to manufacture. Market research suggests that if they sell the device for $100, they will be able to sell 30,000 items. For each $10 they lower the price, they estimate they will sell 5,000 more items. Assuming quantity demanded is linearly related to price, determine the price that will maximize profit
Let p be the price per item, and q be the quantity the company can sell. We start by creating a linear demand function, of the form  .
.
If they sell the device for $100, they will be able to sell 30,000 items, giving the point (30000, 100).
We are told that for each $10 they lower the price, they estimate they will sell 5,000 more items. We can either directly interpret this as a slope, or use it to create a second point. Lowering the price to $90 would raise the quantity sold to 35,000, giving a second point (35000, 90).
Finding the slope:

The demand equation will look like  . Substituting in
  to solve for b:

We now have our demand function:  .
.
Now we construct our revenue function, using our demand curve:

Substituting in the demand function for p

Now looking at costs, we know the fixed costs are $700,000, and the per-item costs are $30, leading to the cost equation

Finally we can construct the profit equation:
Profit = Revenue – Cost

Now to find the maximum we find the vertex of the quadratic:

To find the price that will produce a demand of 32,500 items, we use the demand function:

To maximize profit, the company should price the device at $95. At that price they should expect to sell 32,500 items, with a total profit of:

Try it Now 4
A new Alaskan author has written a children’s book. The set-up printing cost is $5000 with a unit per book cost of $0.70. Market research suggests that if they sell the books for $10 each, they can sell 2000 books, but if they sell them for $20, they will only sell 1000 books. Assume that demand is linearly related to price, find the price that will maximize profit, the quantity that should be printed and the maximum profit.
Try it Now Answers

 in Standard form,
  in Vertex form, Vertical intercept at (0,13).
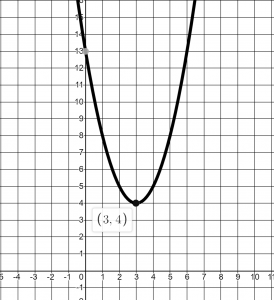
- Demand Function:
 , Revenue:
  , Cost:
  Profit:
  Maximum Profit demand quantity: 1465, Price for Maximum Profit: $15.35, Maximum Profit $16,462.25
Media Attributions
- gardenbackyard
- example51graph
- happygraph
- sadgraph
- takenote is licensed under a Public Domain license
- examplewritingeqofquad
- tin512
- examplegraph51
- bookgraph511
- tinanswer513
